Order Book Depth Visualizer
Enter bid and ask price levels with corresponding quantities to visualize market depth. See the bid-ask spread, cumulative volume, and potential support/resistance zones.
Support/Resistance Zones
Enter data to see potential support and resistance levels based on volume clusters.
Quick Summary
- Order book data shows every live buy and sell order, giving a real‑time view of market depth.
- Key elements are bids, asks, the best bid/ask prices and the bid‑ask spread.
- Analyzing order flow helps spot hidden support, resistance and momentum shifts.
- Common traps include spoofing and the sheer speed of order changes.
- Modern platforms offer heatmaps, cumulative totals and AI‑driven alerts to simplify analysis.
What is Order Book Data?
In electronic markets, order book data acts like a live ledger that records every limit order placed for a security, currency pair or cryptocurrency. Each entry captures two values - the price a trader is willing to transact at and the quantity they want to buy or sell. Because the data updates every fraction of a second, it reveals supply and demand before a trade actually occurs, unlike a price chart that only shows past executions.
Core Components: Bid and Ask
A Bid is a buy order. Platforms sort bids from highest to lowest price, so the top‑most line represents the most aggressive buyer. An Ask (or offer) is a sell order, arranged from the lowest to the highest price. When you look at a typical order‑book window, the left column lists bids (often in green) and the right column lists asks (usually in red).
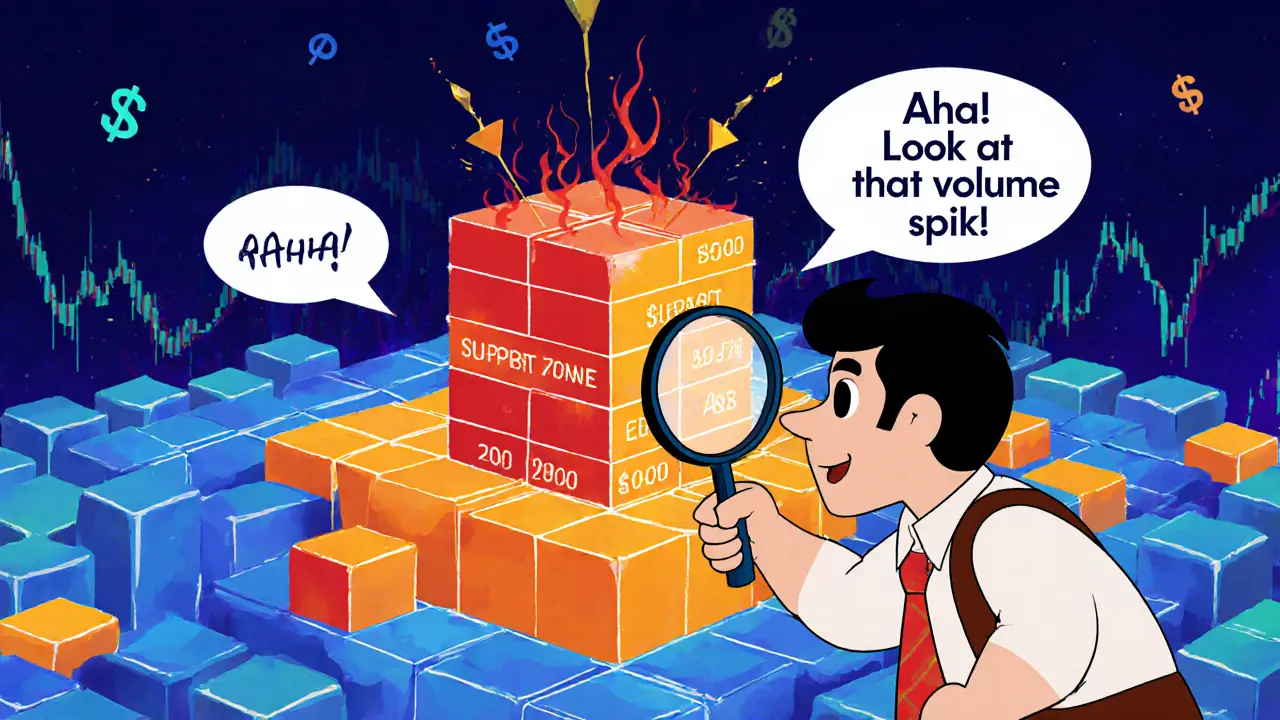
Understanding Best Bid, Best Ask and the Bid‑Ask Spread
The Best Bid is the highest price a trader is currently willing to pay. The Best Ask is the lowest price a seller will accept. The difference between them is the Bid‑Ask Spread, a key indicator of liquidity. A narrow spread suggests a deep market where large orders can be filled with little price impact, while a wide spread often signals thin liquidity or heightened uncertainty.
Market Depth and Order Flow Insights
Market Depth (or Depth of Market, DOM) expands the view beyond the top bid and ask, showing the cumulative quantity available at each price level. Traders watch clusters of large orders as invisible support or resistance zones. Order Flow tracks how those clusters change over time-whether big buy orders are hitting the ask, or substantial sell orders are draining the bid side. Sudden imbalances can foreshadow short‑term price moves.
Applying Order Book Data in Trading Strategies
One popular technique is the volume‑weighted average price (VWAP) algorithm. By slicing a large order across multiple price levels that match the prevailing depth, VWAP minimizes market impact. Another approach is “order‑book scalping,” where a trader places a limit order just inside the best bid or ask and captures the spread as the price flickers. Advanced quant models even feed the entire order‑book snapshot into machine‑learning classifiers to predict the next tick direction.
Common Pitfalls: Spoofing and Data Overload
Regulators flag Spoofing as illegal-traders place large orders they intend to cancel seconds later, creating a false impression of demand or supply. Retail participants often mistake these transient spikes for genuine momentum, leading to premature entries. Moreover, the sheer velocity of updates can overwhelm a human eye. Without proper filters or aggregation, you may chase “ghost” liquidity that vanishes the moment you act.
Tools, Visualizations and Comparison
Modern platforms layer a heatmap over the raw book, coloring price levels by cumulative volume. Some offer a three‑dimensional view where time is the third axis, helping spot recurring patterns. Below is a quick side‑by‑side comparison of a traditional price chart versus an order‑book‑centric view.
| Feature | Order Book View | Price Chart |
|---|---|---|
| Shows pending liquidity | Yes - bids and asks at multiple levels | No - only executed trades |
| Highlights hidden support/resistance | Yes - order clusters | Often inferred |
| Real‑time updates | Milliseconds | Seconds to minutes |
| Vulnerable to spoofing | Yes | No |
| Easy for beginners | Steeper learning curve | More intuitive |
Step‑by‑Step Guide to Analyzing an Order Book
- Open the order‑book window and locate the best bid and best ask prices.
- Scan the depth on both sides. Note any price levels where the cumulative volume spikes - these act as potential support (bids) or resistance (asks).
- Watch the delta (difference) between bid volume and ask volume over the last few seconds. A growing bid delta suggests buying pressure.
- Check for rapid order cancellations. A flurry of large orders that disappear within seconds may indicate spoofing.
- Combine the book view with a VWAP or moving‑average overlay to decide where to place your limit order.
- Set alerts for when the price reaches a volume cluster you identified as a key level.
- After execution, compare the fill price to the depth at that moment to evaluate slippage.
Checklist for Effective Order Book Analysis
- Confirm your platform displays cumulative totals, not just raw line items.
- Filter out orders smaller than a pre‑defined threshold to reduce noise.
- Identify the top three bid and ask clusters by volume.
- Monitor the bid‑ask spread; set a maximum spread you’re comfortable trading within.
- Watch for abnormal order size spikes that disappear quickly - possible spoof.
- Record the time of significant order‑flow changes for post‑trade review.
- Back‑test any strategy that relies on depth signals before risking real capital.
Frequently Asked Questions
Why does the order book change so fast?
Electronic markets match orders in microseconds. Every participant - from retail traders to high‑frequency firms - can submit, modify or cancel orders instantly, so the book refreshes thousands of times per second.
Can I trade directly from the order book?
Yes. Most platforms let you click a price level and place a limit order at that exact price, effectively “standing on the book.” Some advanced tools even allow “iceberg” orders that hide part of your size.
What’s the difference between market depth and order flow?
Market depth shows the static snapshot of volume at each price. Order flow tracks how that snapshot evolves - which side is adding or removing volume over time.
Is order‑book analysis useful for crypto markets?
Absolutely. Because crypto exchanges run 24/7 and often have thinner liquidity, the order book can reveal real‑time supply‑demand imbalances that are invisible on price charts.
How can I protect myself from spoofing?
Look for large orders that appear and vanish within a few seconds, especially if they sit far from the best price. Using a filter to ignore orders above a certain size or duration can help.

